Global Hunger Index 2026: Ranking, Score and Data for India
The Global Hunger Index 2026 was published on October 14, 2026, under the theme "No food security, no security." India ranks 100th out of 122 countries assessed, with 24.1 points, placing it in the "severe" category. A complete analysis for UPSC preparation is available, including a breakdown of indicators, a table by country, and questions from official calls for applications.

Gajendra Singh Godara
Last updated
8
mins read

The Global Hunger Index 2026 was released on October 14, 2026 in Berlin, two days before World Food Day.
This year's edition is structured around a straightforward premise: "Without food security, there is no security".
India ranks 100th out of 122 countries, with a score of 24.1, a figure that keeps it in the "serious" category. It shares this 100th place with Ethiopia.

Key Highlights
India's position: 100th out of 122, score of 24.1, level serious.
Retarded child growth (chronic malnutrition): 29.3%, compared to 50.0% recorded in 2000.
Child wasting (acute malnutrition): 19.0%, the highest figure in the entire report.
Population with caloric undernourishment: 9.8%.
The global average worsens: it goes from 17.6 points in 2018 to 18.1 in 2026.
Eight countries fall into the "alarming" severity category.
The Hunger Index is an annual, peer-reviewed publication that assesses food insecurity on a scale of 0 to 100 points.
A value of 0 represents the absolute absence of hunger; 100 represents the most critical situation possible.
The Global Hunger Index report is published by the German organization Welthungerhilfe, which in recent years has partnered with the Irish organization Concern Worldwide.
Verification note: Information sources for the 2026 edition show discrepancies regarding participating organizations, so it is advisable to check the final list of publishers at globalhungerindex.org.
Note for the Prelims test: The International Food Policy Research Institute (IFPRI) was listed as a co-editor in the early editions of the index and appeared in that role in historical UPSC questions. It is no longer involved in the report's production.
Join our WhatsApp Community
The four components of the global hunger index are not weighted equally. This methodological imbalance is often the most common criticism leveled by opponents.

Indicator | Weighting | What it measures |
|---|---|---|
Undernourishment | One third | Percentage of the population with insufficient daily calorie intake |
Childhood stunting | One-sixth | Children under five years of age with a height below that expected for their age, reflecting chronic malnutrition |
Childhood wasting | One sixth | Children under five years of age with insufficient weight for their height, reflecting acute malnutrition |
Infant mortality | One third | Mortality rate in children under five |
Severity Categories

Rating | Category |
|---|---|
9.9 or less | Low |
10.0 to 19.9 | Moderate |
20.0 to 34.9 | Severe |
35.0 to 49.9 | Alarming |
50.0 or more | Extremely alarming |
Indicator | Value recorded by India |
|---|---|
IGH Score | 24.1 |
Rank | 100 out of 122 (shared with Ethiopia) |
Severity level | Severe |
Undernourishment | 9.8% |
Childhood stunting | 29.3% (compared to 50.0% in 2000) |
Child wasting | 19.0% (the most unfavorable result in the report) |
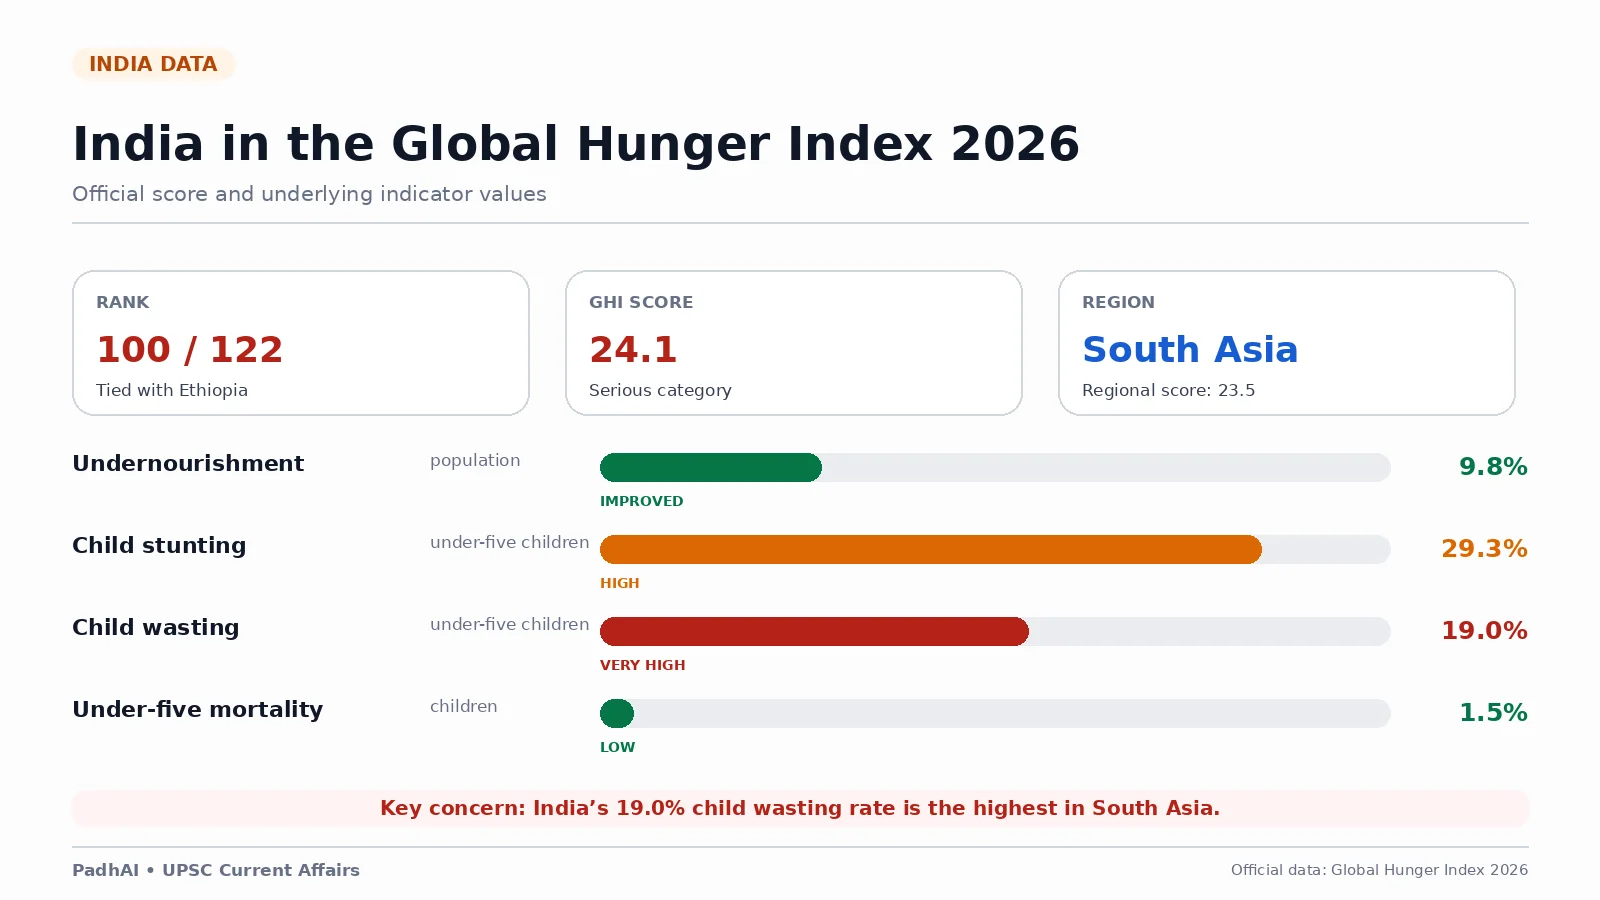
The last two rows require a joint reading because they describe contrasting realities. Chronic malnutrition is a consequence of prolonged structural deprivation; in this area, the 20.7 percentage point decrease since 2000 represents real progress.
In contrast, wasting measures acute and immediate nutritional crises, and here India shows the worst figure in the report.
While the country's overall score improved from 37.0 in 2006 to the current 24.1, its assigned category remains stuck at the severe level.
Caution when comparing ratings between years
Year | India's Ranking | Countries Analyzed | Score |
|---|---|---|---|
2020 | 94 | 107 | 27.2 |
2022 | 107 | 121 | 29.1 |
2023 | 111 | 125 | 28.7 |
2024 | 105 | 127 | 27.3 |
2026 | 100 | 122 | 24.1 |
The number of states evaluated changes each year. Using ranking as the sole criterion for improvement distorts the analysis.
The index's own authors insist that valid comparisons are based on historical scores, which are recalculated with each edition. In an official assessment, the argument should be based on the score, never on the ranking.
Add as a preferred Source on Google
Country | Rating | Category |
|---|---|---|
Nepal | 14.5 | Moderate |
Bangladesh | 19.2 | Moderate |
India | 24.1 | Grave |
Pakistan | 25.5 | Grave |
South Asia has an average score of 23.5, compared to the global average of 18.1. This region and sub-Saharan Africa continue to experience the most severe levels of food deprivation on the planet.
Finding | Factual detail |
|---|---|
Stagnation of progress | The global average rose from 17.6 points in 2018 to 18.1 in 2026 |
Direct setbacks | Hunger worsened quantitatively in 32 countries |
Unmet goals | 57 countries will reach 2030 without achieving the low hunger category |
Alarming level | Eight nations fall into this range, including Somalia, Sudan, Yemen, Chad, and Burundi |
Determining factors | Recurring armed conflicts, climate crisis and rising cost of living |
The theme of this edition explicitly links scarcity with geopolitical stability. The vast majority of countries in critical situations are experiencing active wars.
The report demonstrates that food shortages are not simply a consequence of conflict, but a direct trigger for new uprisings.
Provision or program | Scope and purpose |
|---|---|
Article 21 | Judicial recognition of the right to food as part of the right to life, consolidated through the PUCL litigation |
Article 47 | Guiding Principle that entrusts the State with raising the level of nutrition and the standard of living of the population |
National Food Security Act (NFSA), 2013 | Legal right to subsidized grain for up to 75% of the rural population and 50% of the urban population |
PM Garib Kalyan Anna Yojana | Free distribution of cereals above the ordinary NFSA allocations |
ICDS (1975) and Saksham Anganwadi | Nutritional supplementation and early childhood care through the Anganwadi network of centers |
Poshan Abhiyaan and Poshan 2.0 | Specific reduction targets for stunting, anemia and low birth weight |
PM POSHAN | Hot meals cooked daily in public schools |
PMMVY | Maternity benefit for pregnant and breastfeeding women |
Anaemia Mukt Bharat and Fortified Rice | Measures aimed at combating micronutrient deficiencies |
SDG 2 | Multilateral commitment to Zero Hunger by 2030 |
Criticisms and counterarguments
Government objection | Argument put forward |
|---|---|
Bias towards childhood | Three of the four indicators exclusively assess children under five, so an index designed for the entire population ends up measuring child nutrition |
Survey methodology | The undernourishment data comes from a population sample whose size the Government considers insufficient |
Exclusion of public schemes | The direct calculation does not incorporate the real impact of large free grain distribution networks |
Inconsistency in rankings | The number of ranked countries varies with each annual report |
The other side of the debate. The choice of pediatric indicators is based on rigorous technical criteria: the nutritional status of children under five is measurable, comparable internationally, and serves as the earliest warning sign of any community deficiency.
Furthermore, India's own NFHS-5 national survey documented a stunting rate of 35.5% and wasting rates of 19.3%.
These figures are very close to those reported in the study, which weakens the argument that the index is subject to external methodological bias.
Pathways of Advancement
Recommended measure | Technical basis |
|---|---|
Transition towards nutritional security | Incorporate millet, legumes and fortified rice into the public distribution system (PDS) basket, moving beyond the exclusivity of wheat and rice |
Clinical approach to wasting | Acute malnutrition requires community treatment and therapeutic foods, not just distribution of raw grain |
Protection during the first 1,000 days | The mother's nutrition during pregnancy and breastfeeding practices determine the child's growth |
Strengthening the Anganwadi network | Provision of better material resources and ongoing training for grassroots staff (ASHA and Anganwadi workers) |
Regular data updates | Conduct surveys at regular intervals so that public decisions are based on current figures |
Climate-adapted agriculture | Dissemination of seeds tolerant to floods and prolonged droughts to ensure supply |
Examination phase | Thematic focus |
|---|---|
Prelims | Publishing entities, the four components and their weights, gravity bands, India's position and score, edition motto |
GS Paper 2 | Problems of poverty and hunger, effectiveness of state assistance programs, vulnerable sectors |
GS Paper 3 | Food security, PDS management, strategic grain reserves and agricultural economics |
Mains | Reasons why a policy focused on calorie volume does not solve structural malnutrition |
Frequently asked question (FAQs)
What position does India hold in the 2026 Global Hunger Index?
Who publishes the Global Hunger Index?
What are the components of the Global Hunger Index?
Which country has the most hunger in the world?
Why does India reject the results of the Global Hunger Index?
Prelims Questions



Gajendra Singh Godara
Ex-UPSC Aspirant | Exam Preparation Expert
Gajendra Singh Godara is an IIT Bombay graduate and a UPSC aspirant with 4 attempts, including multiple Prelims and Mains appearances. He specializes in Polity, Modern History, International Relations, and Economy. At PadhAI, Gajendra leverages his firsthand exam experience to simplify complex concepts, creating high-efficiency study materials that help aspirants save time and stay focused.

No comments yet. Be the first to join the discussion!